Comcast Telcom Customer Complaint Analysis
DESCRIPTION :
•Comcast is an American global telecommunication company.
•The firm has been providing terrible customer service.
•They continue to fall short despite repeated promises to improve.
•Only last month (October 2016) the authority fined them a $2.3 million, after receiving over 1000 consumer complaints.
•The existing database will serve as a repository of public customer complaints filed against Comcast.
•It will help to pin down what is wrong with Comcast's customer service.
Dataset Description :
• Ticket #: Ticket number assigned to each complaint
• Customer Complaint: Description of complaint
• Date: Date of complaint
• Time: Time of complaint
• Received Via: Mode of communication of the complaint
• City: Customer city
• State: Customer state
• Zipcode: Customer zip
• Status: Status of complaint
• Filing on behalf of someone
Analysis Task:
•To perform the tasks, I used different Python libraries such as NumPy, SciPy, Pandas, scikit-learn, matplotlib, and BeautifulSoup.
•Trend chart for the number of complaints at monthly and daily granularity levels.
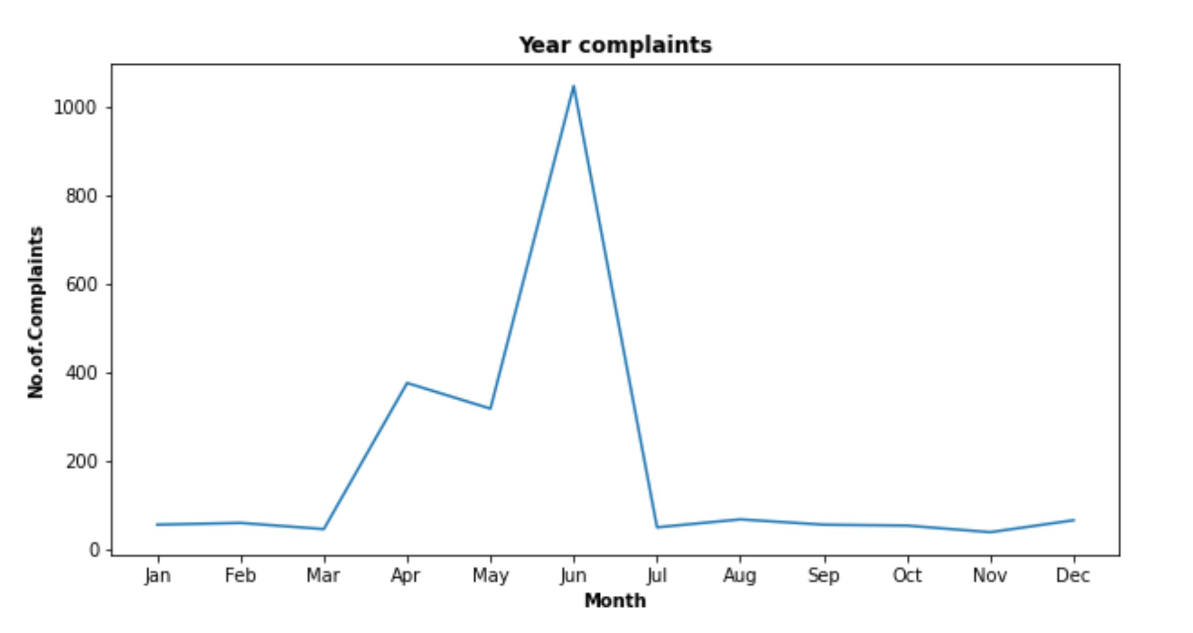
Complaints Monthly
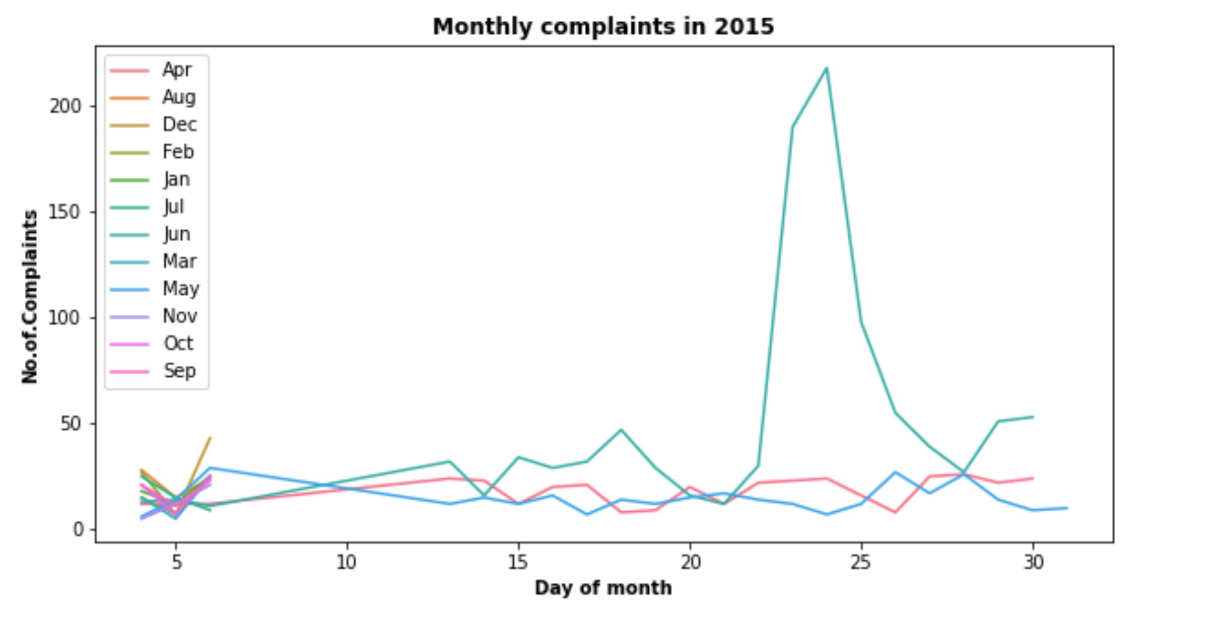
Daily Granularity Levels
•Finding which complaint types are maximum i.e., around internet, network issues, or across any other domains.
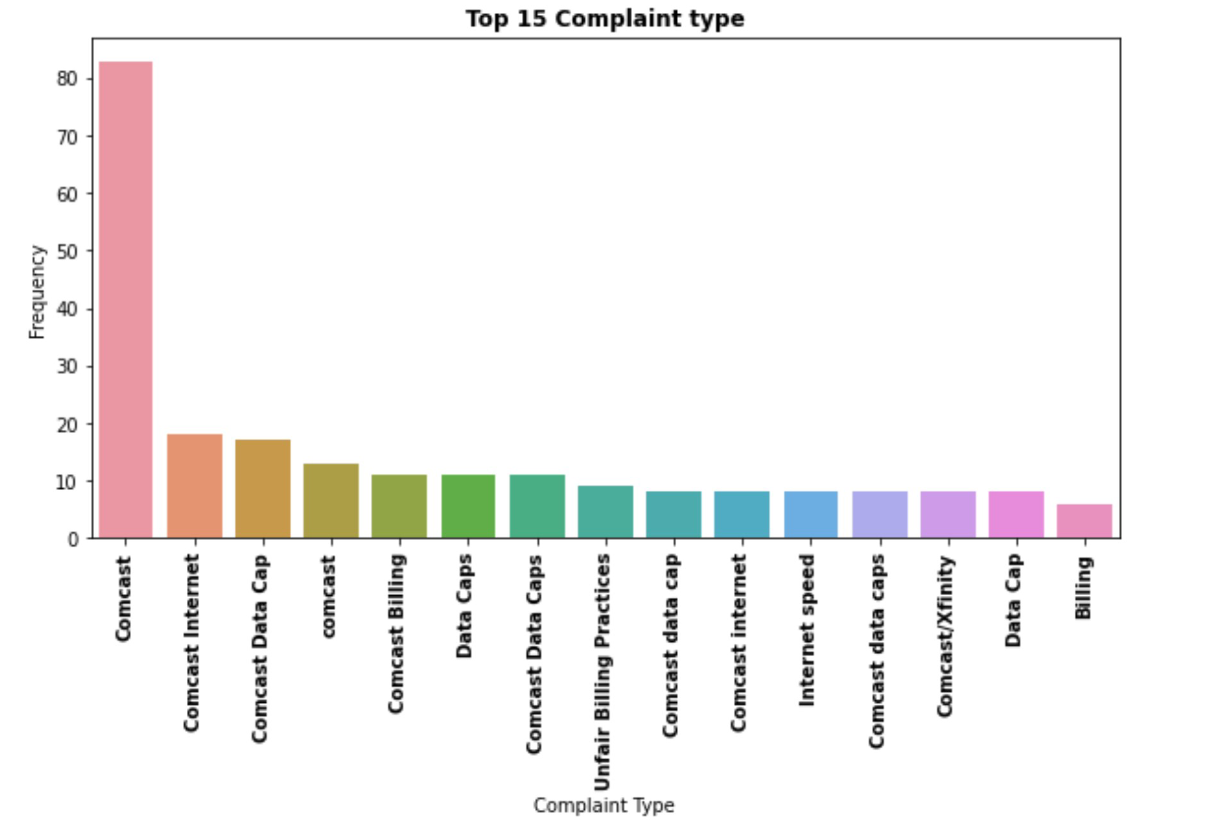
Complaint Types
•Create a new categorical variable with value as Open and Closed. Open & Pending is to be categorized as Open and Closed & Solved is to be categorized as Closed.
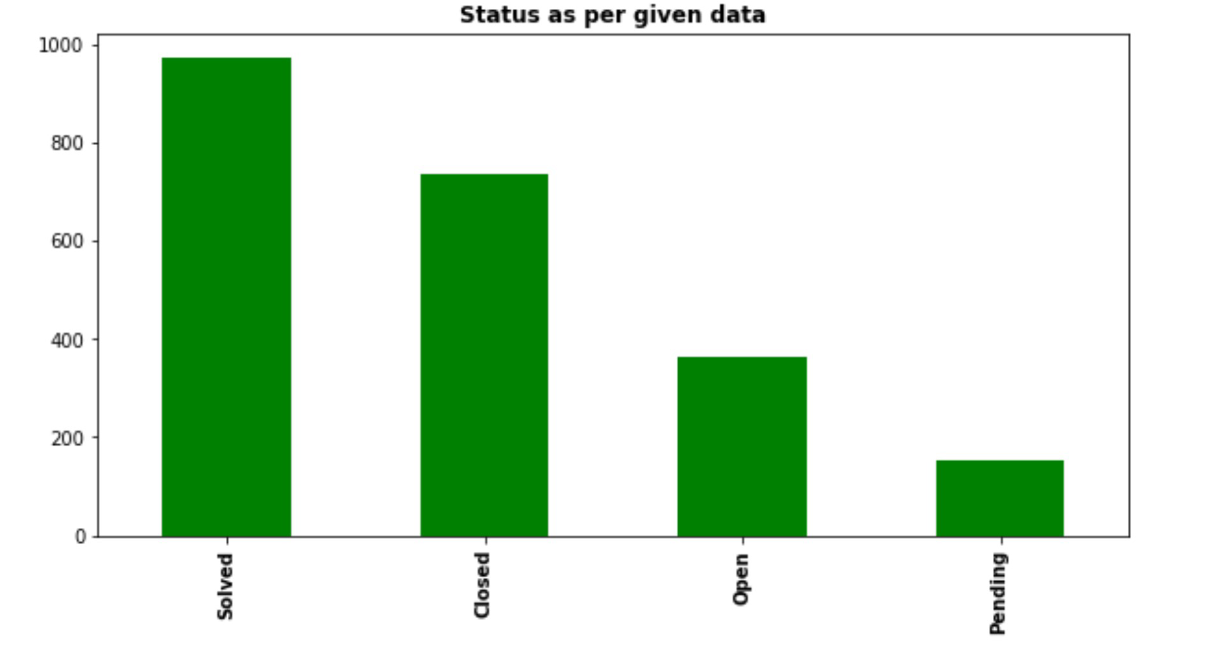
Complaint Status
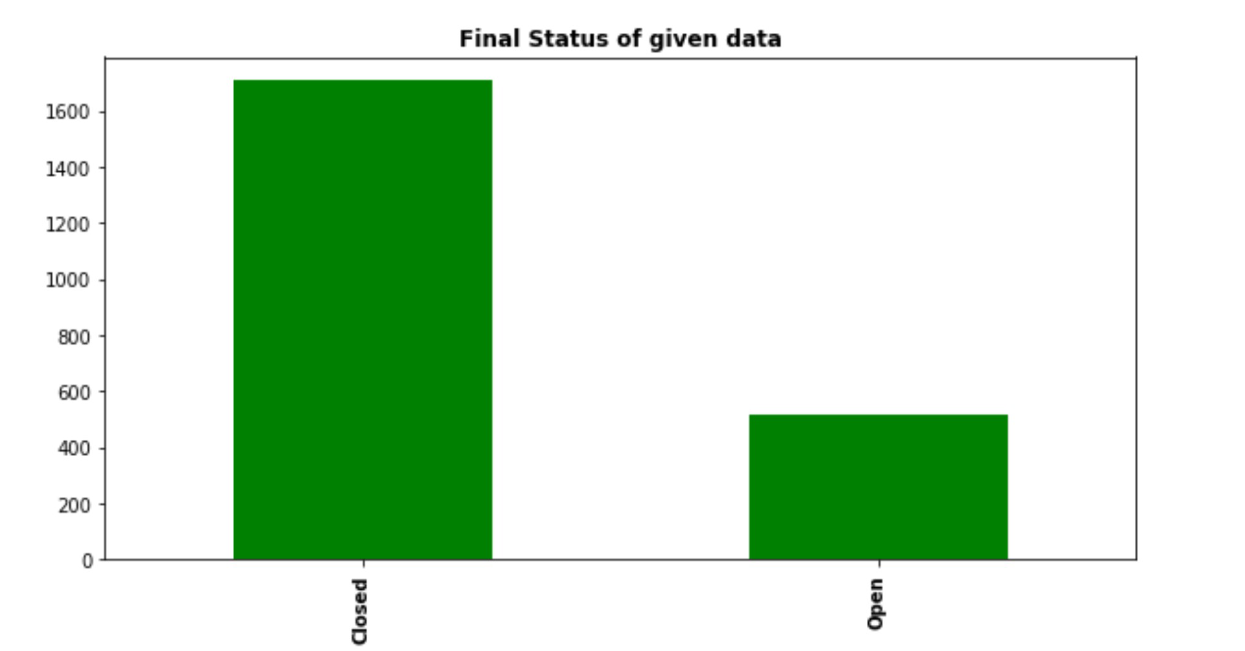
Final Status
•Provide state wise status of complaints in a stacked bar chart. Use the categorized variable from Q3.
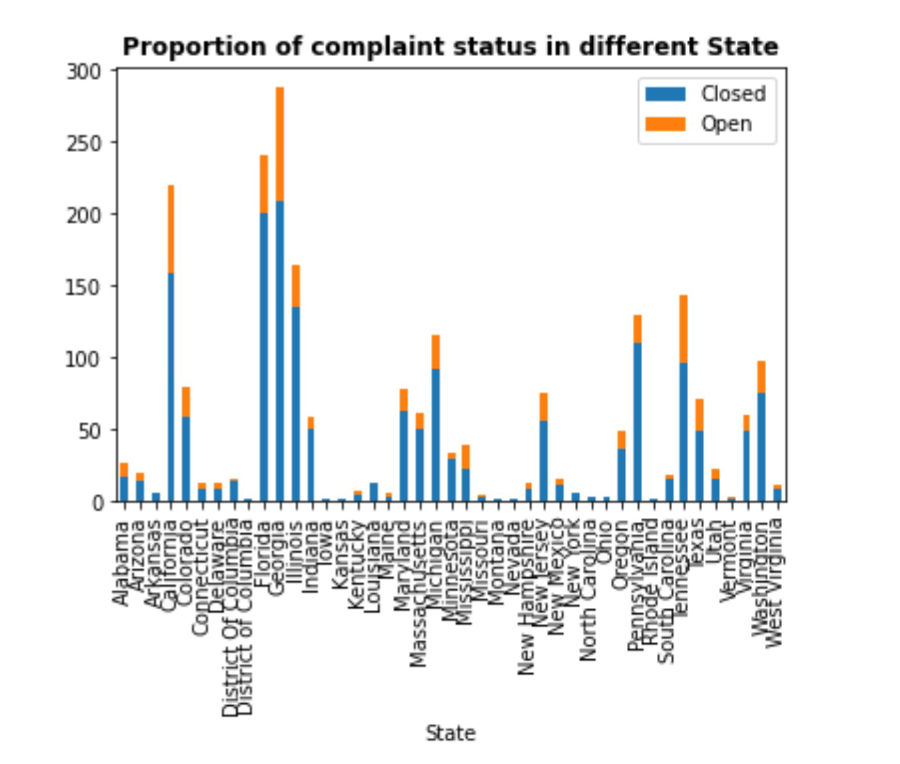
Complaint Status with different state
•Finding which state has the maximum complaints
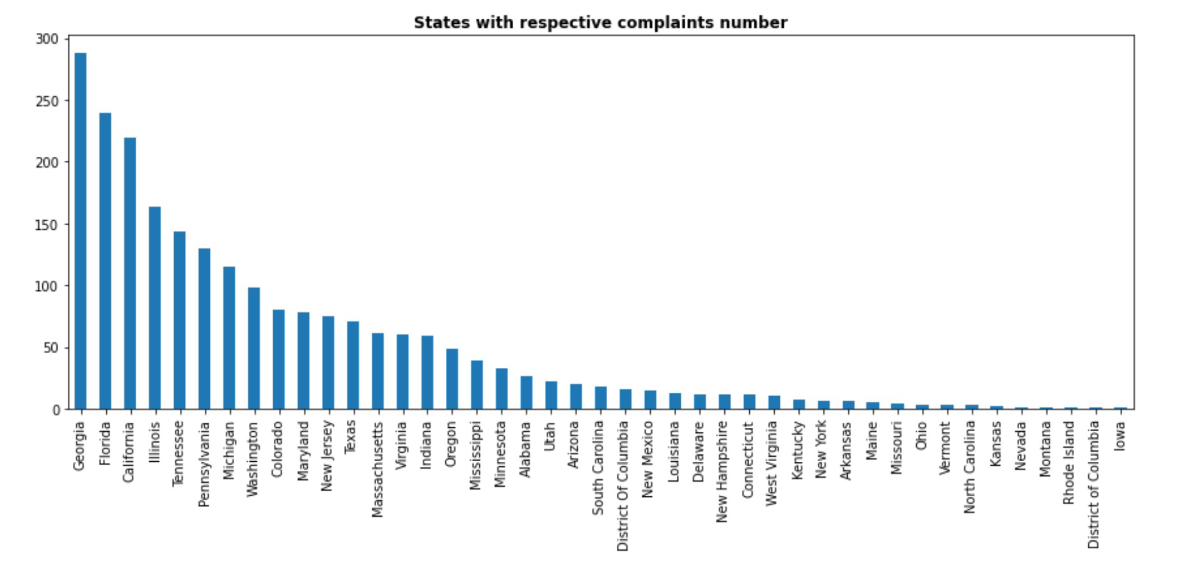
States with respective complaint numbers
•Solved complaint percentage is 76.5.
•Unsolved complaint percentage is 23.25.
•Plotting State Wise Complaint
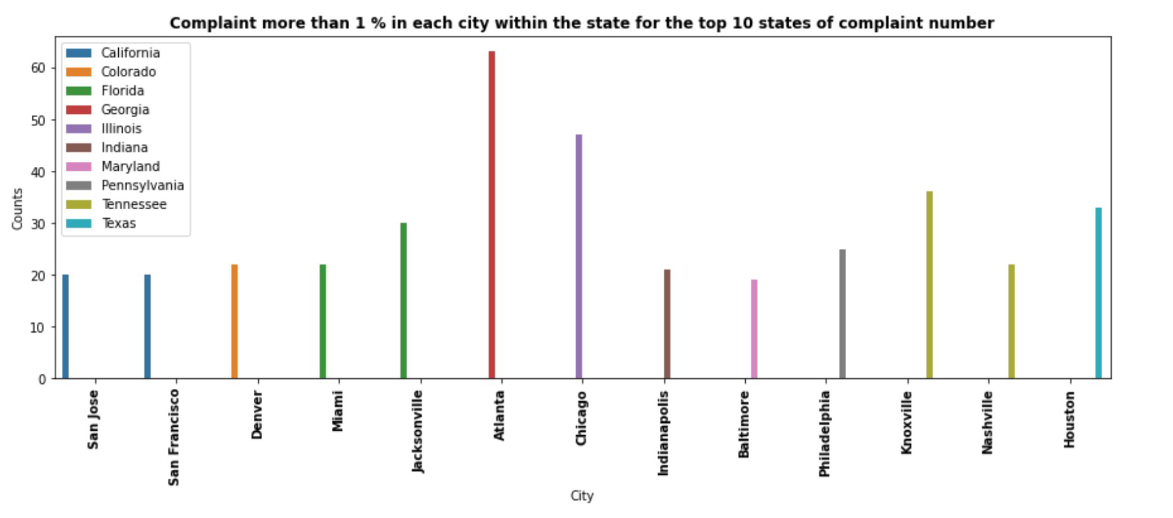
Top 10 Complaint States
•Finding Top 30 states with complaints lodged on behalf of someone
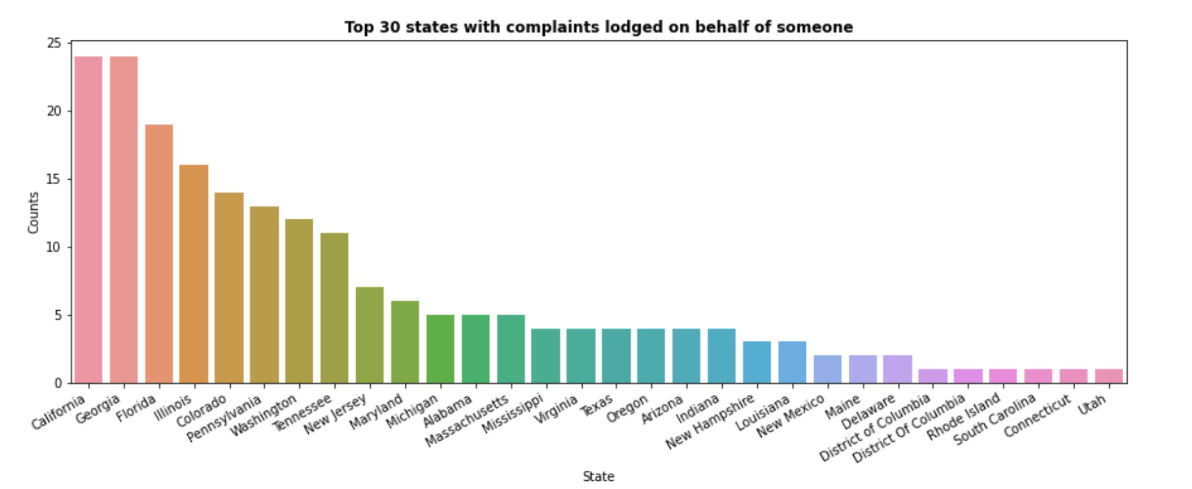
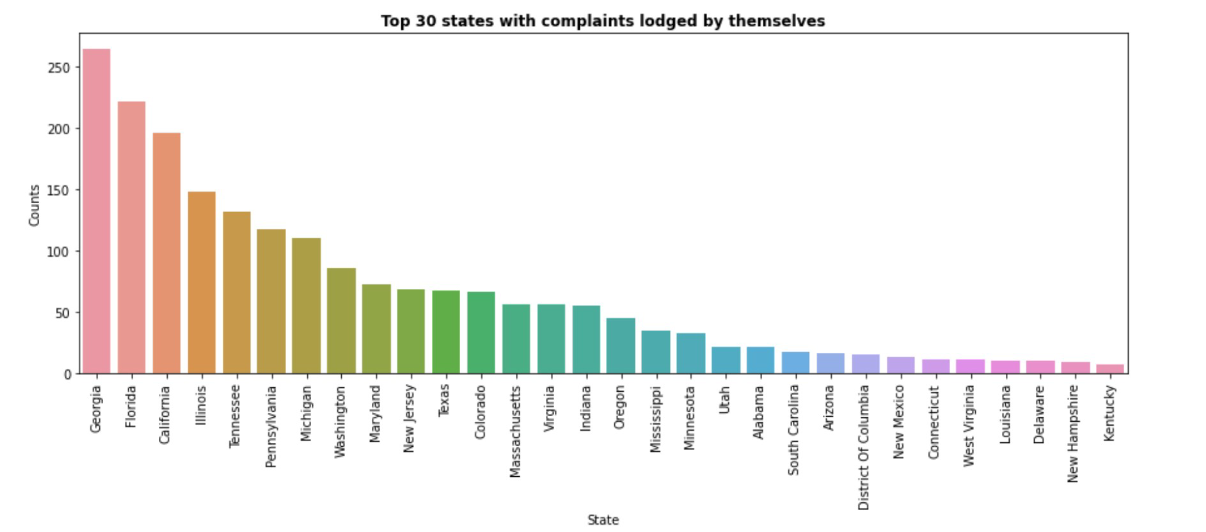
•Finding Top 30 states with complaints lodged by themselves
