Elder Fall Detection
Machine Learning Methodologies
• Sensor data consist of Accelerometer (X, Y, Z), Gyro (X, Y, Z), Euler (X, Y, Z), Timestamps and Frame counter.
• Label data consist of Task ID, Trial ID, Description, Frame Onset and Frame Impact.
• So, I created a new csv file which consist of Accelerometer (X, Y, Z), Gyro (X, Y, Z), Euler (X, Y, Z), Subject, Task ID, Trial ID and Description.
• The reason, I created new csv file for model developing is very complicated to use K-fall sensor data along with K-fall label data because sensor data folder consists of 32 sub folder each folder consists of many csv files. Likewise, label data also consist of 32 csv files and then label data does not have Accelerometer (X, Y, Z), Gyro (X, Y, Z), Euler (X, Y, Z) data value it’s also one of the reasons for me to create the csv file.
• Let me clearly explain what label data consist of? the label data which consist of 15 types of falls in Description column along with frame onset and frame impact which was corresponding to the frame counter column that present in K-fall sensor data. And Task ID which consist of 36, but we are considering from 20 to 34 that is Fall Task ID and others are some activities which was not labelled in description column and we are neglecting it. Each Task ID consist of 5 or more Trial ID which means 5 or more csv file in sensor data.
• To reduced complexity for building the model we just merge the particular columns and rows of sensor data with label data into one file. For an example, the fall onset frame and fall impact frame are 130 and 208 in the corresponding to sensor data of frame counter column respectively. So, I consider to make row from fall onset frame and fall impact frame values with columns of Accelerometer (X, Y, Z), Gyro (X, Y, Z), Euler (X, Y, Z) data value along with Task ID, Trial ID and Description of falls respectively for each and every label data files. And, it nearly came around more than 1 lakhs data values.
• And, I took help from my colleagues to create this csv file because it’s large dataset file.
• To build the model, I used certain framework like Pandas for EDA analysis, Matplotlib for data visualization, Scikit for model building and Wandb also for model developing.
• I build the model with very few traditional ML algorithms and they are
I. Logistic Regression
II. Decision Tree
III. Random Forest Tree
IV. Support Vector Machine
V. KNeighbors Classifier
• First the data file was imported using pandas to read the csv file and then I, checked for any null values in the data file. After that I, used seaborn to visualize the description column to count the number of falls types.
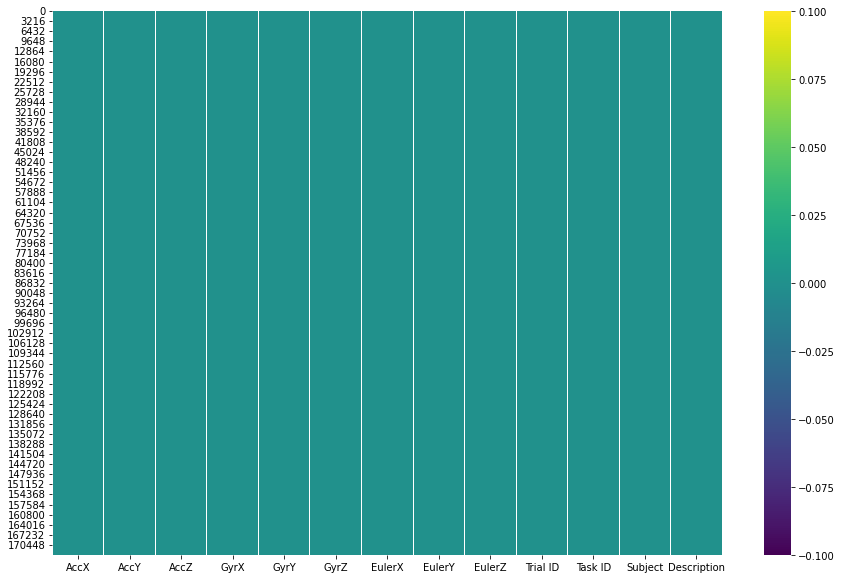
Null Data Visualization
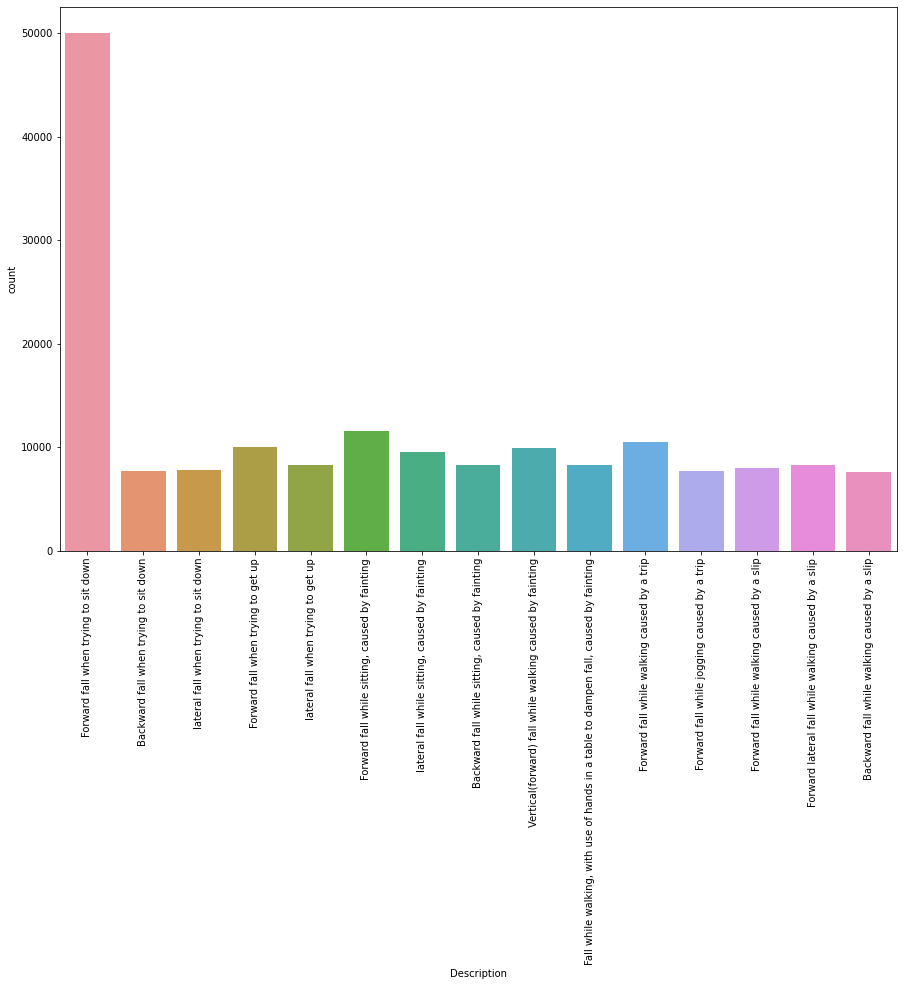
Count Visualization Y Variable
• And then I, created X and Y variable. X variable consists of Accelerometer (X, Y, Z), Gyro (X, Y, Z) and Euler (X, Y, Z). Y variable consist of Description.
• Sklearn label encoder used for converting Y variable object type into int64.
• Again, using sklearn for pre-processing X variable into standard scaler value.
• Using sklearn, I just split the data by importing train_test_split and set the test size as 30% and balance 70% data for training.
• X_train, y_train, X_test and y_test variable consists of train_test_split data values.
• Training and testing data are passed to each and individual ML algorithm by using Sklearn.
• By using sklearn the accuracy of Logistic regression is 34%, Decision tree is 77%, Random Forest is 91%, KNeighbors classifier is 85% and Support Vector Machine is 81%.
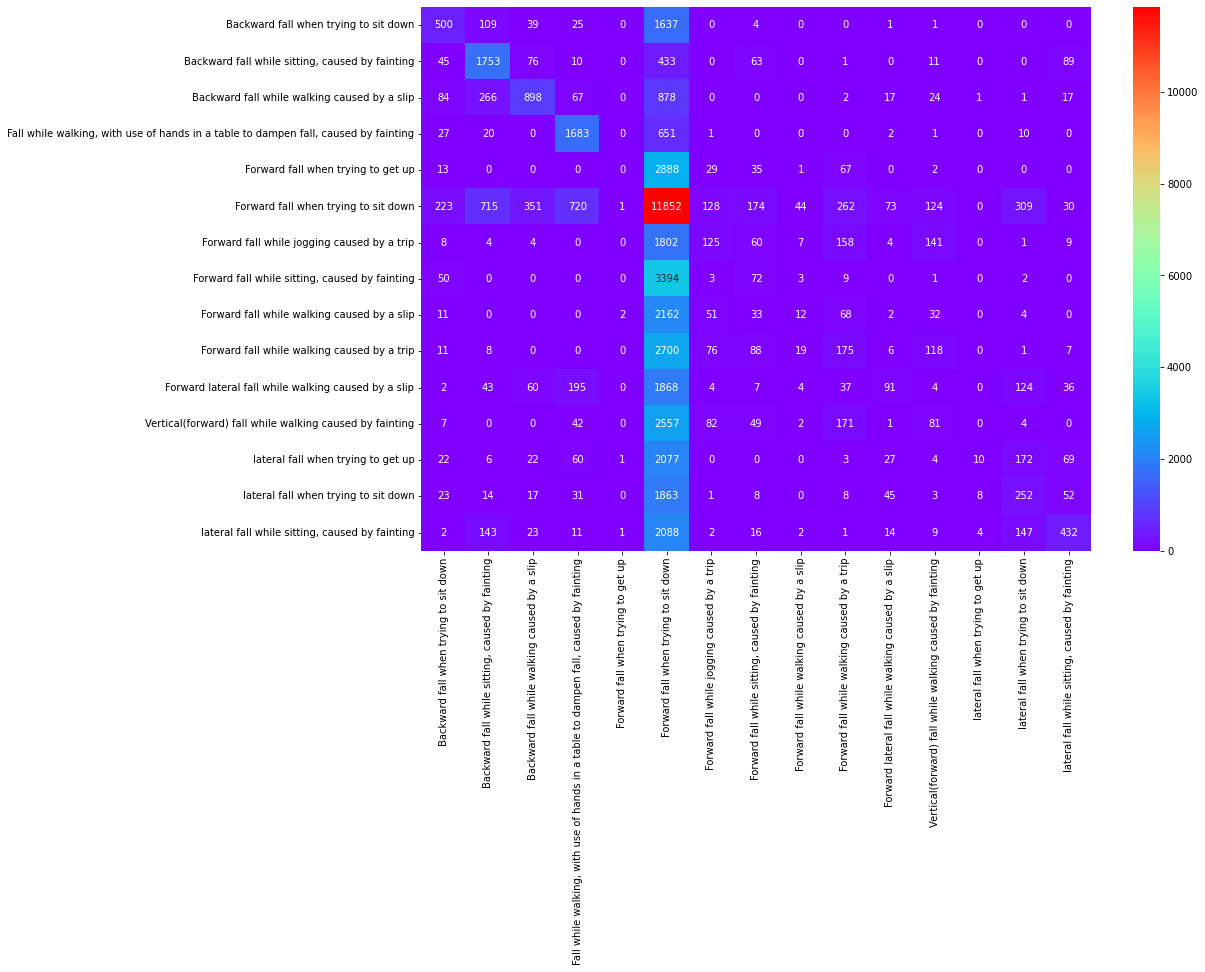
Logistic Regression Confusion Matrix
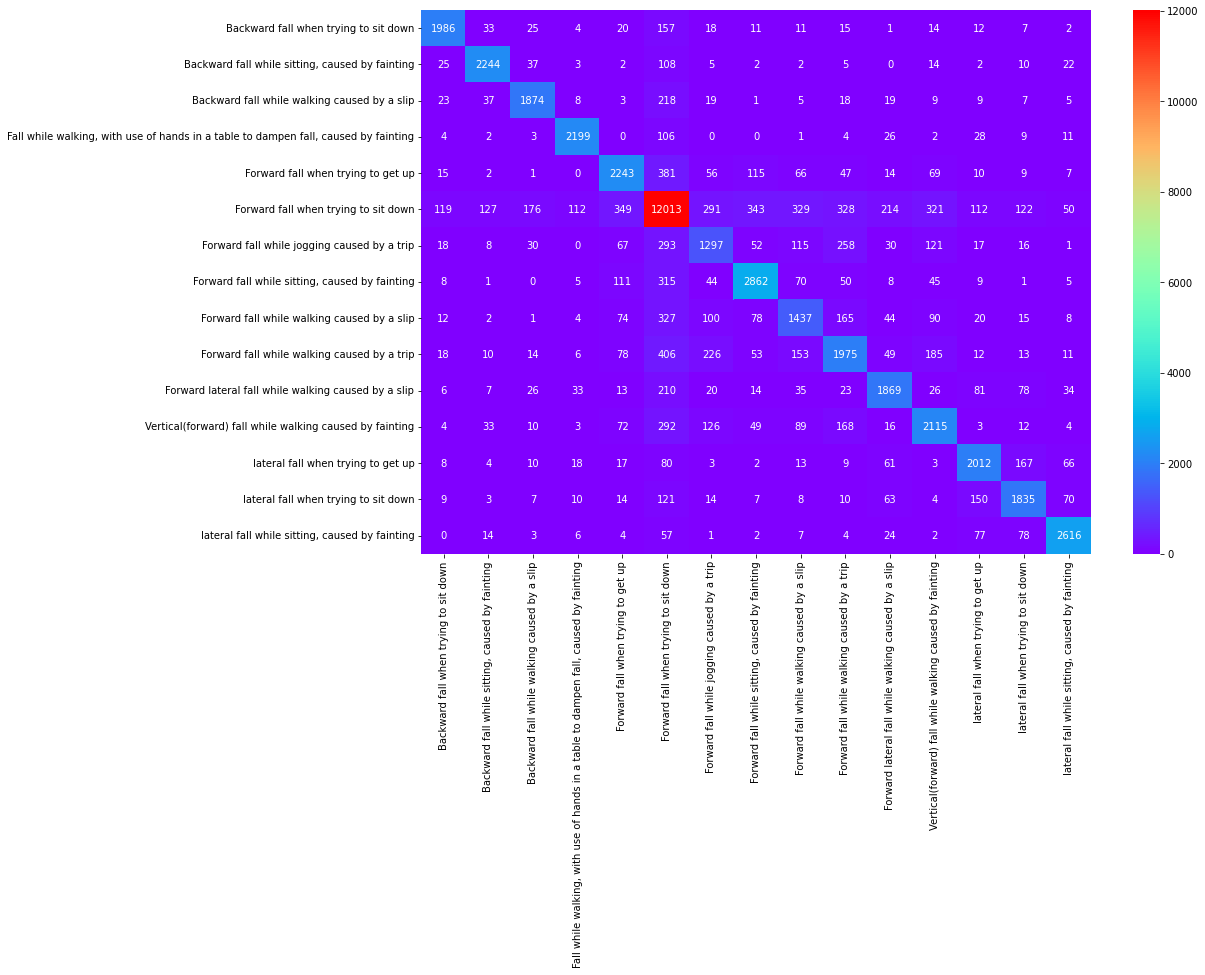
Decision Tree Confusion Matrix
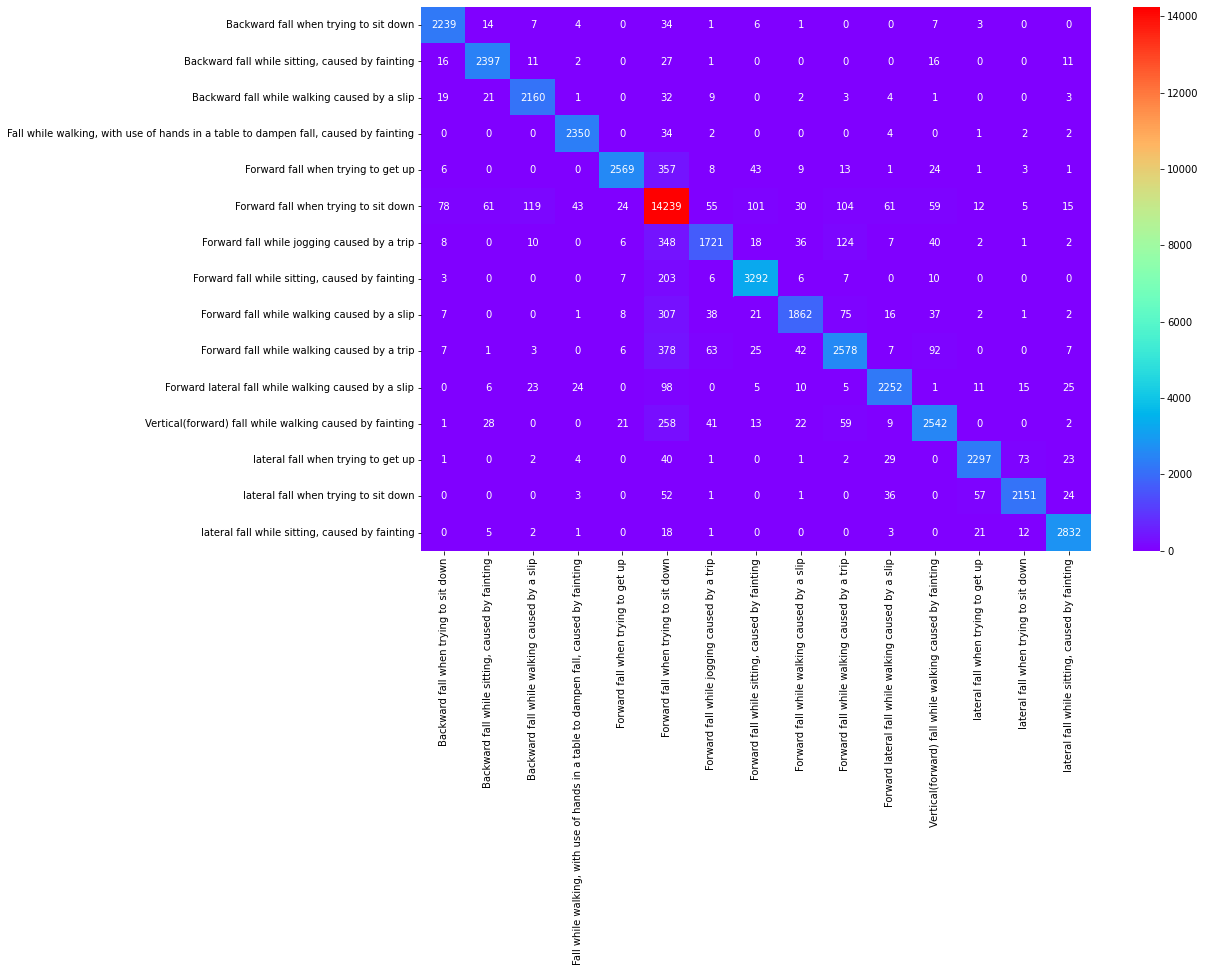
Random Classifier Confusion Matrix
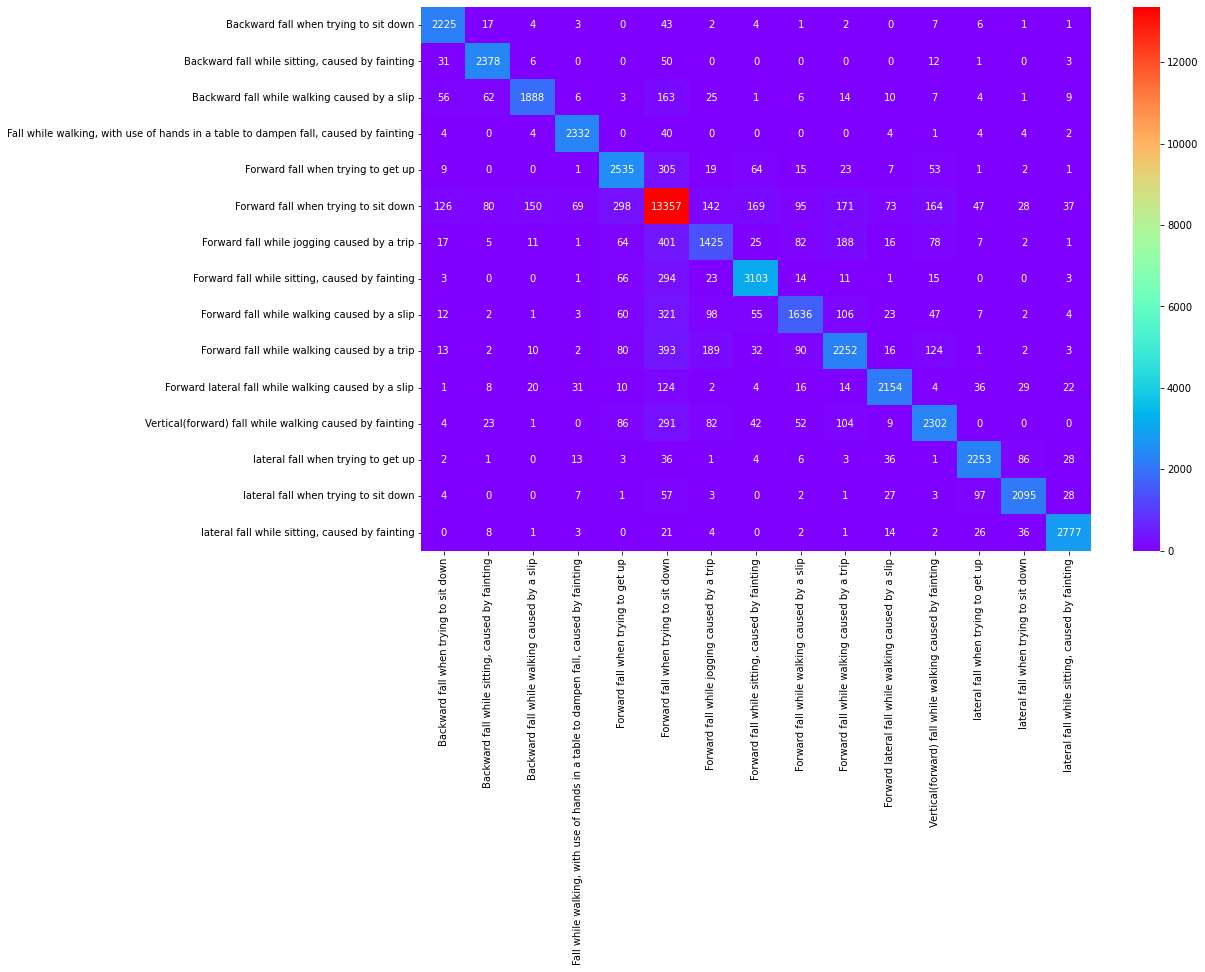
KNeighbors Classifier Confusion Matrix
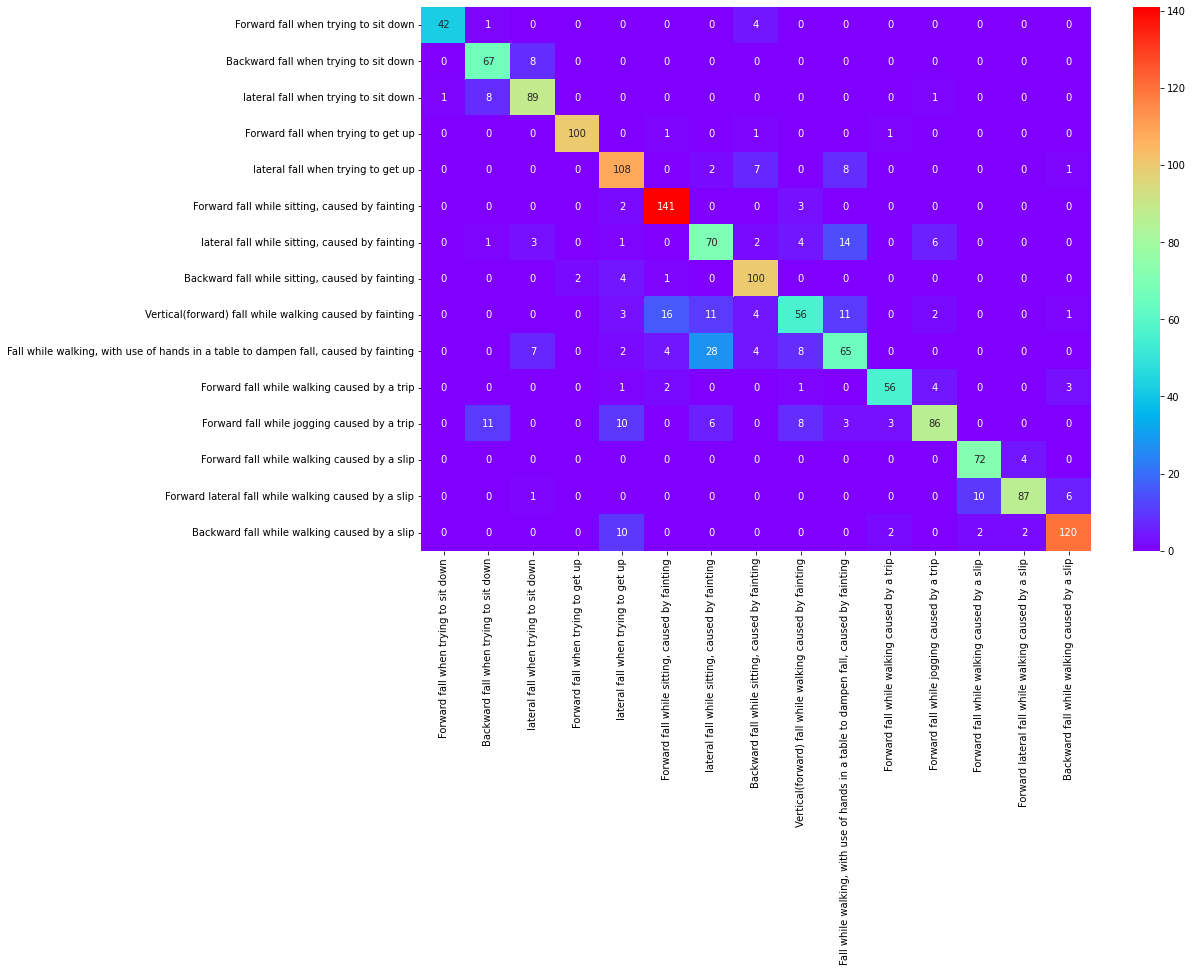
Support Vector Machine Confusion Matrix
Deep Learning Methodologies
• In Deep Learning, I made slight changes in Y variable like converting the forward fall when trying to sit down, forward fall when trying to get up and forward fall when walking all these forward fall converted as one variable as "Forward".
• Similarly, other Y variable are converted into "Backward","Dampen",And "Lateral" falls.
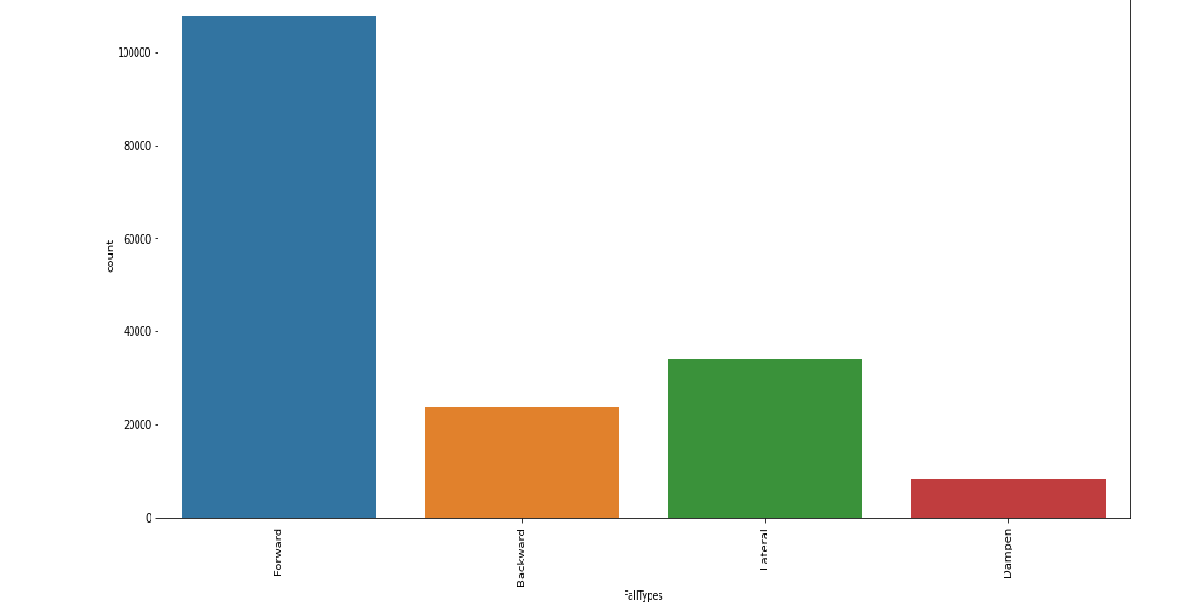
Count Visualization
• For pre-processing, I used MinMaxScaler and Standarscaler.
• Using Tensorflow sequential model with activation function: relu and softmax; optimizer function:"Adam"; Loss function: "Categorical_crossentropy."
• And I achieved the accuracy of 100%.
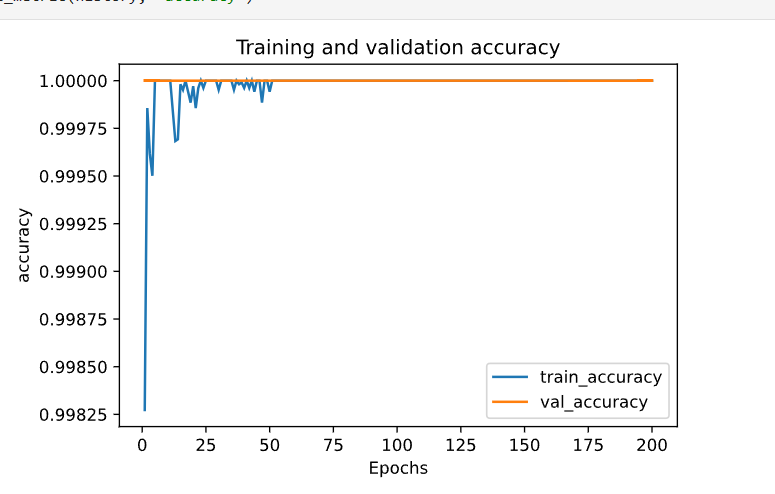
Validation Accuracy
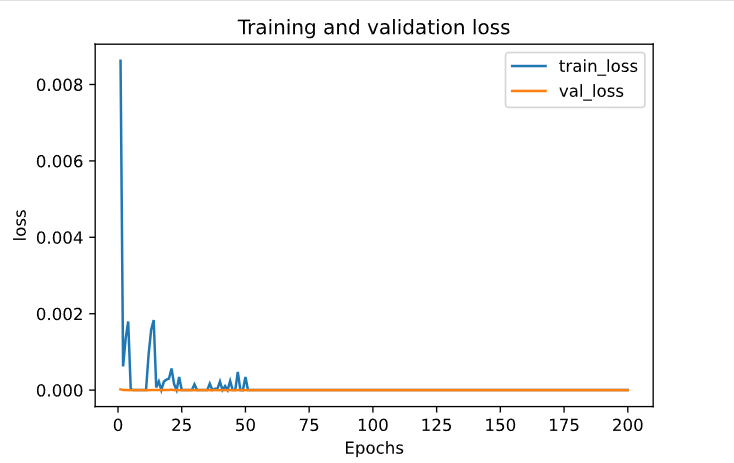
Validation Loss
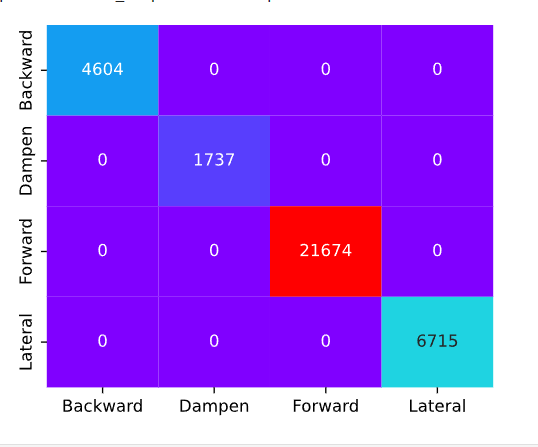
Sequential Model Confusion Matrix


